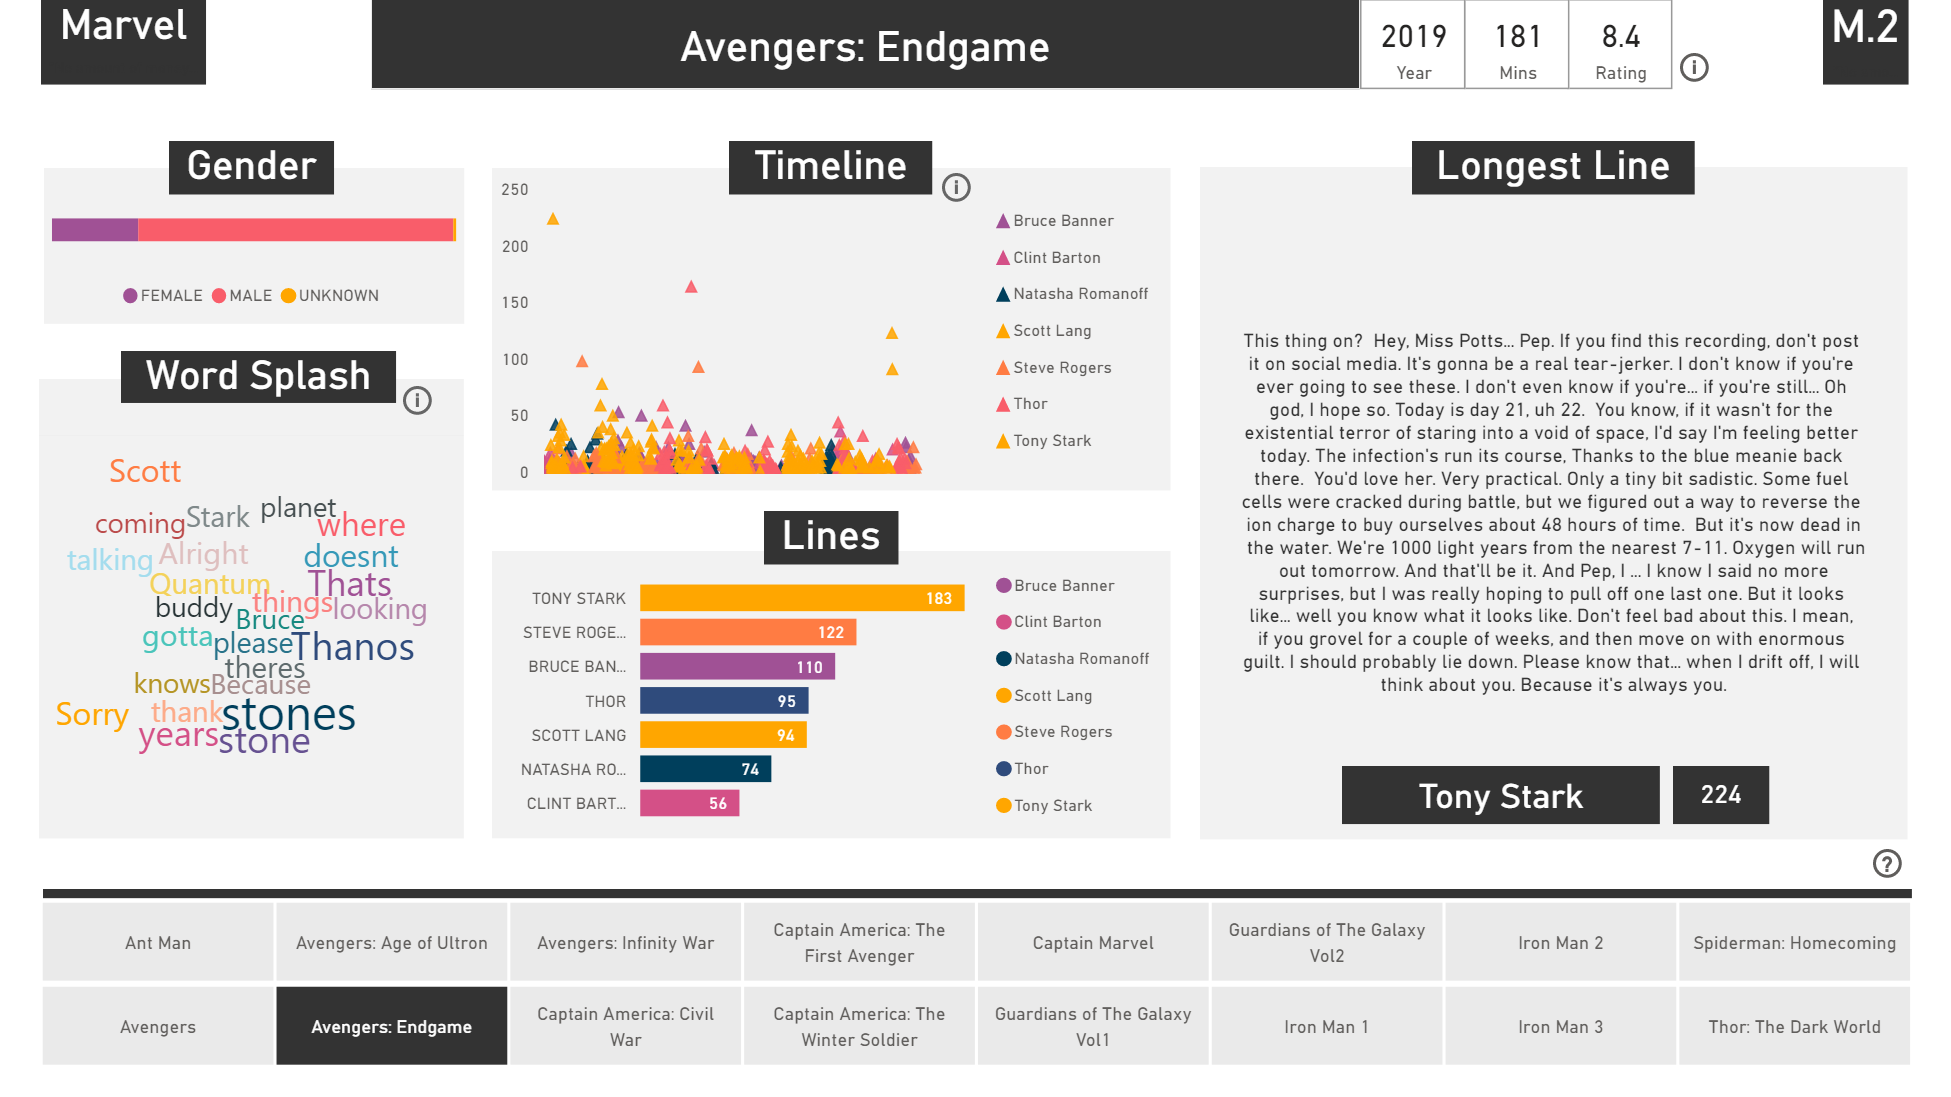
Processing film transcripts and interpreting data between several major franchises, aiming to highlight the individual successes, gender divides and other significant trends. The Marvel franchise takes the spotlight due to it’s large fanbase, who continue to collaborate and create fan-made transcripts for each film as they are released. The content is visualized through the Power BI platform and can be accessed publicly in any web browser, or through the Power BI app.

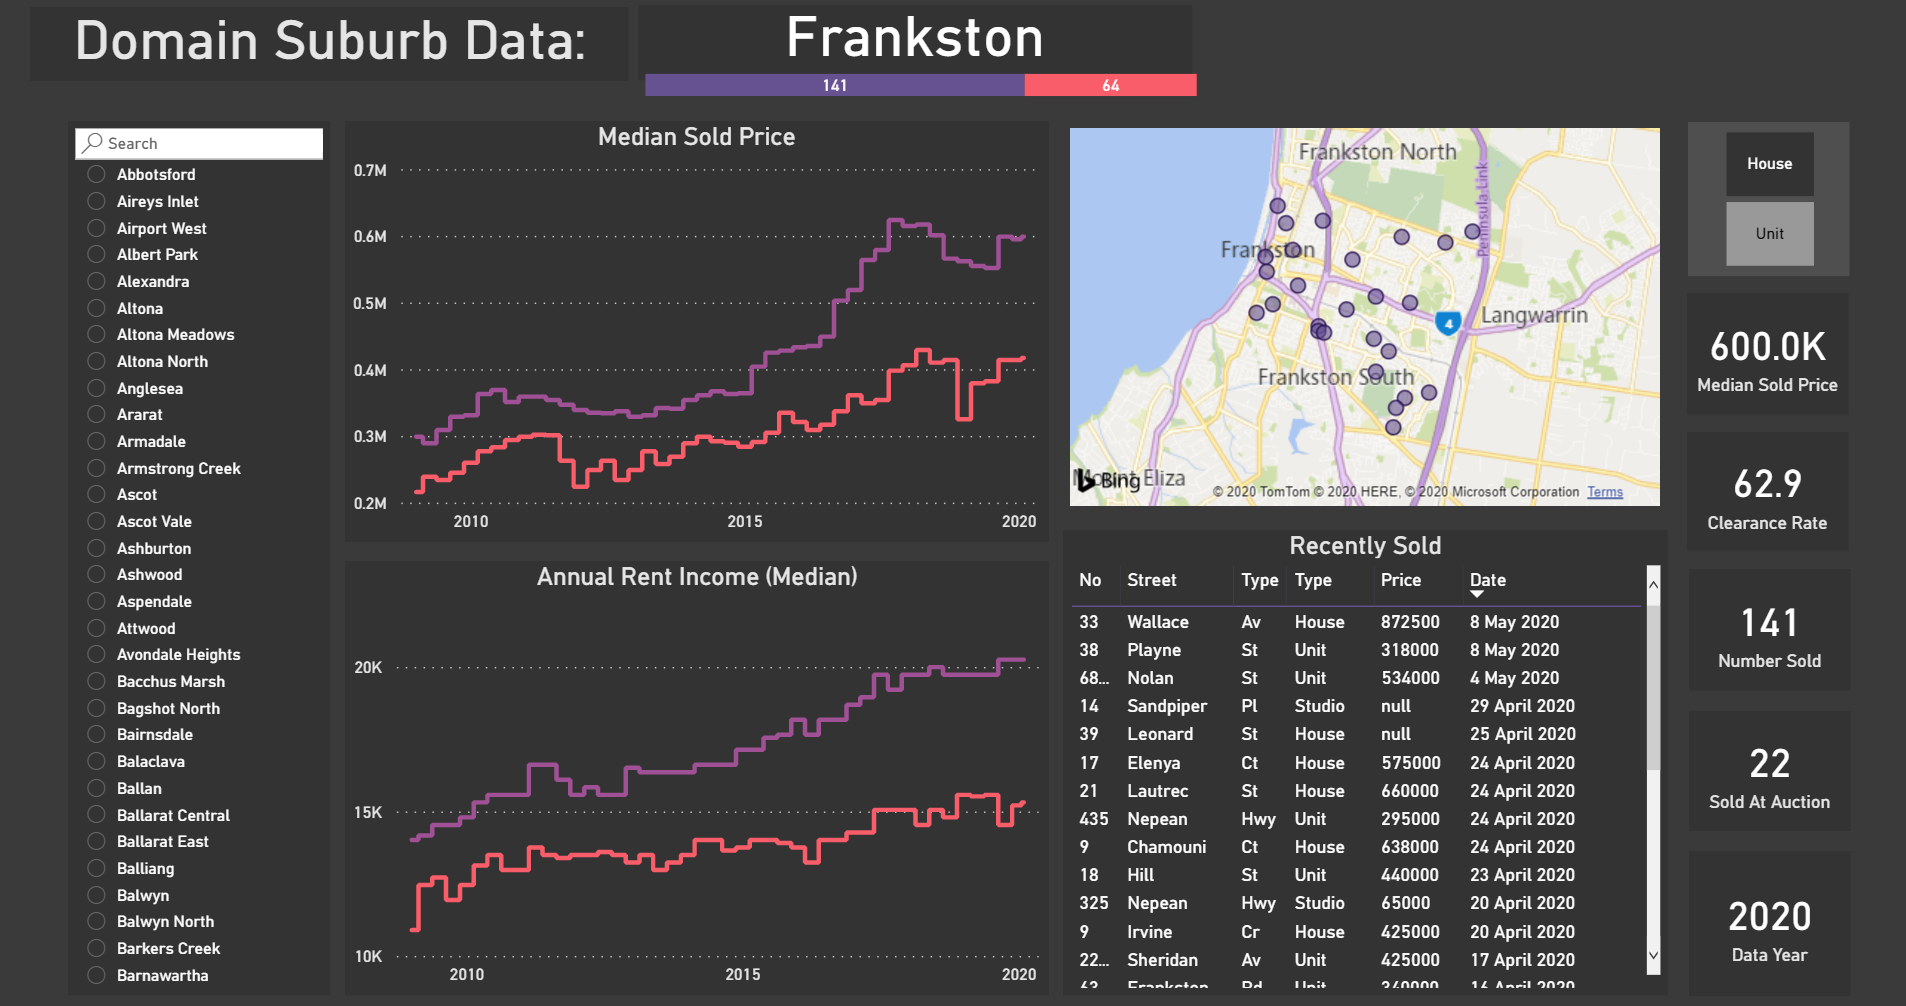
Transforming data to create powerful visualization tools that assist in making an informed decision when choosing the location of the next investment property or home. This includes suburb performance, demographics, and auction results for nearly 500 suburbs across metropolitan suburbs and Victoria. Information is updated as it is made available, making it easy to access current data.

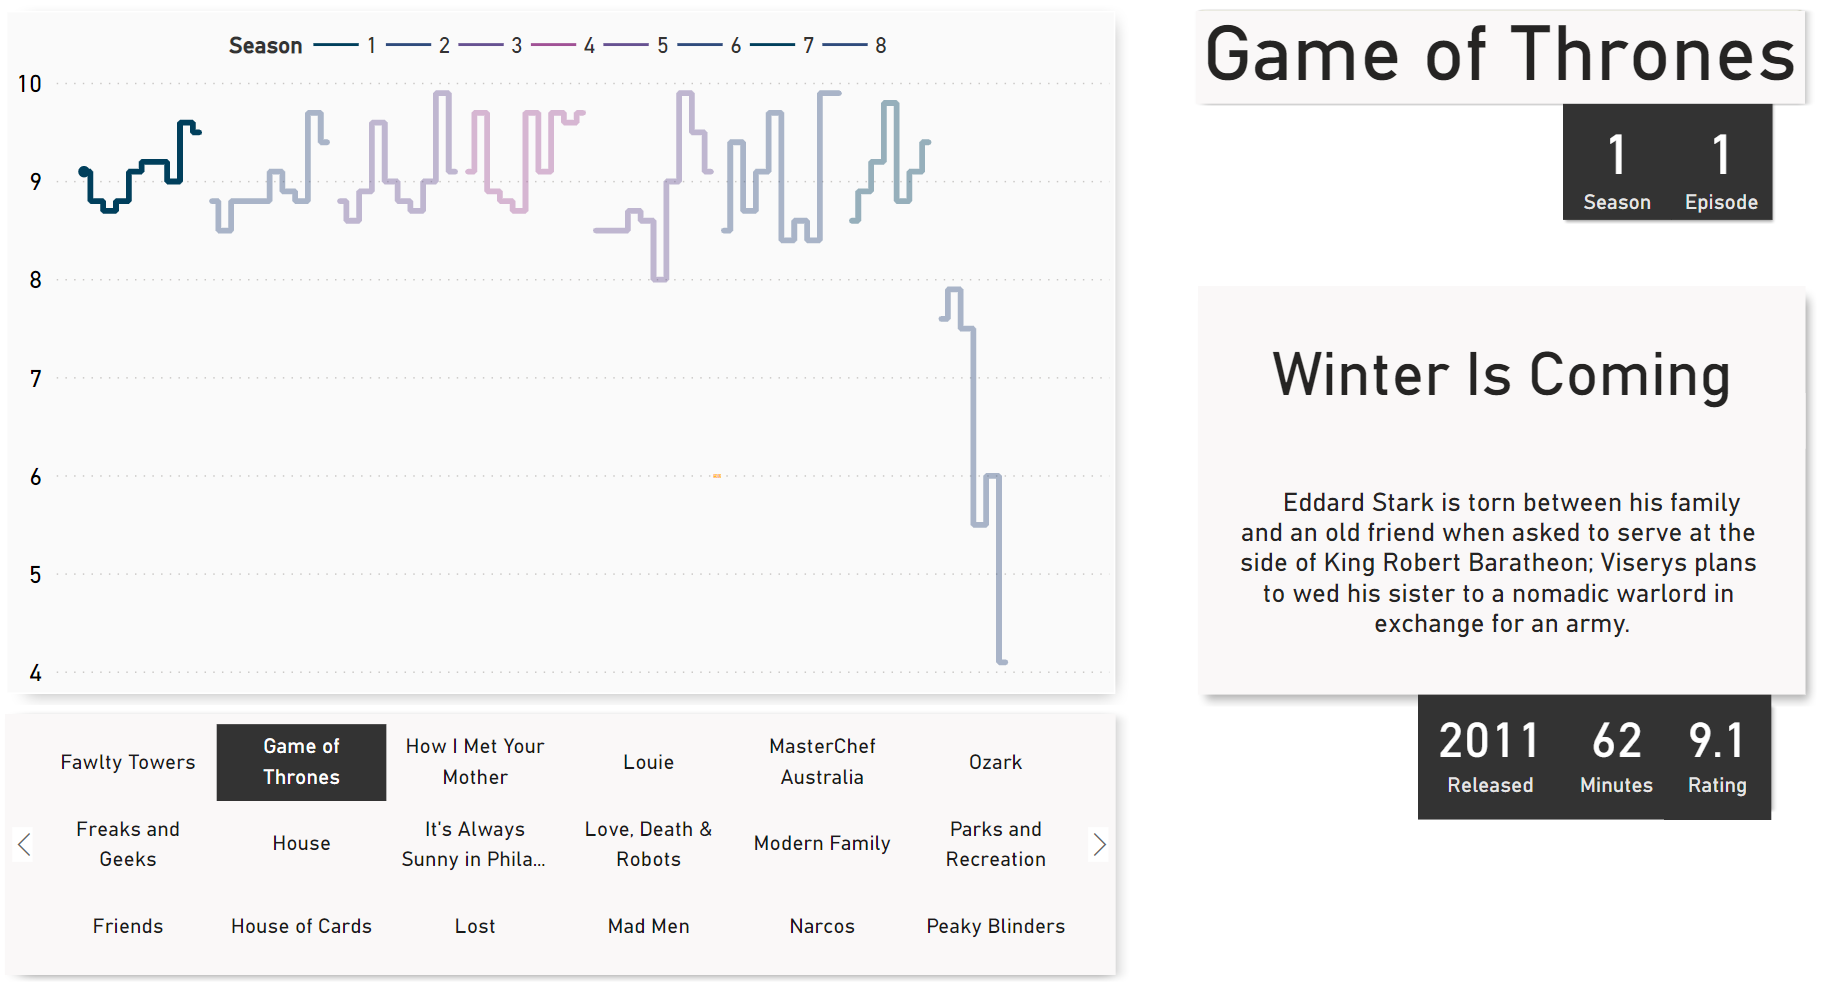
Ever wondered what episodes of your favorite TV series faced a poor reception? Interested in seeing which ones are the most loved? I occasionally see articles or social media posts where someone has compiled these answers, however they either apply to a single series or the data is not interactive. What if I wanted to visualize this data for any given series, immediately find the worst rated episodes and then cozy up on the couch to watch a glorious train wreck?


