Domain X ABS Census Data Explorer
Using API's to find properties with sustainable capital growth

This has been a project that, in its humble beginnings was an excuse to boost my data management skills and has since gradually transformed into an (almost) end-to-end product. The motivation to create this spawned from the arduous navigation required to view real estate data online, not to mention the time spent doing it. What if I wanted to quickly pull-up a suburb, see not only the long-term historical performance, but also the value of recently sold properties?
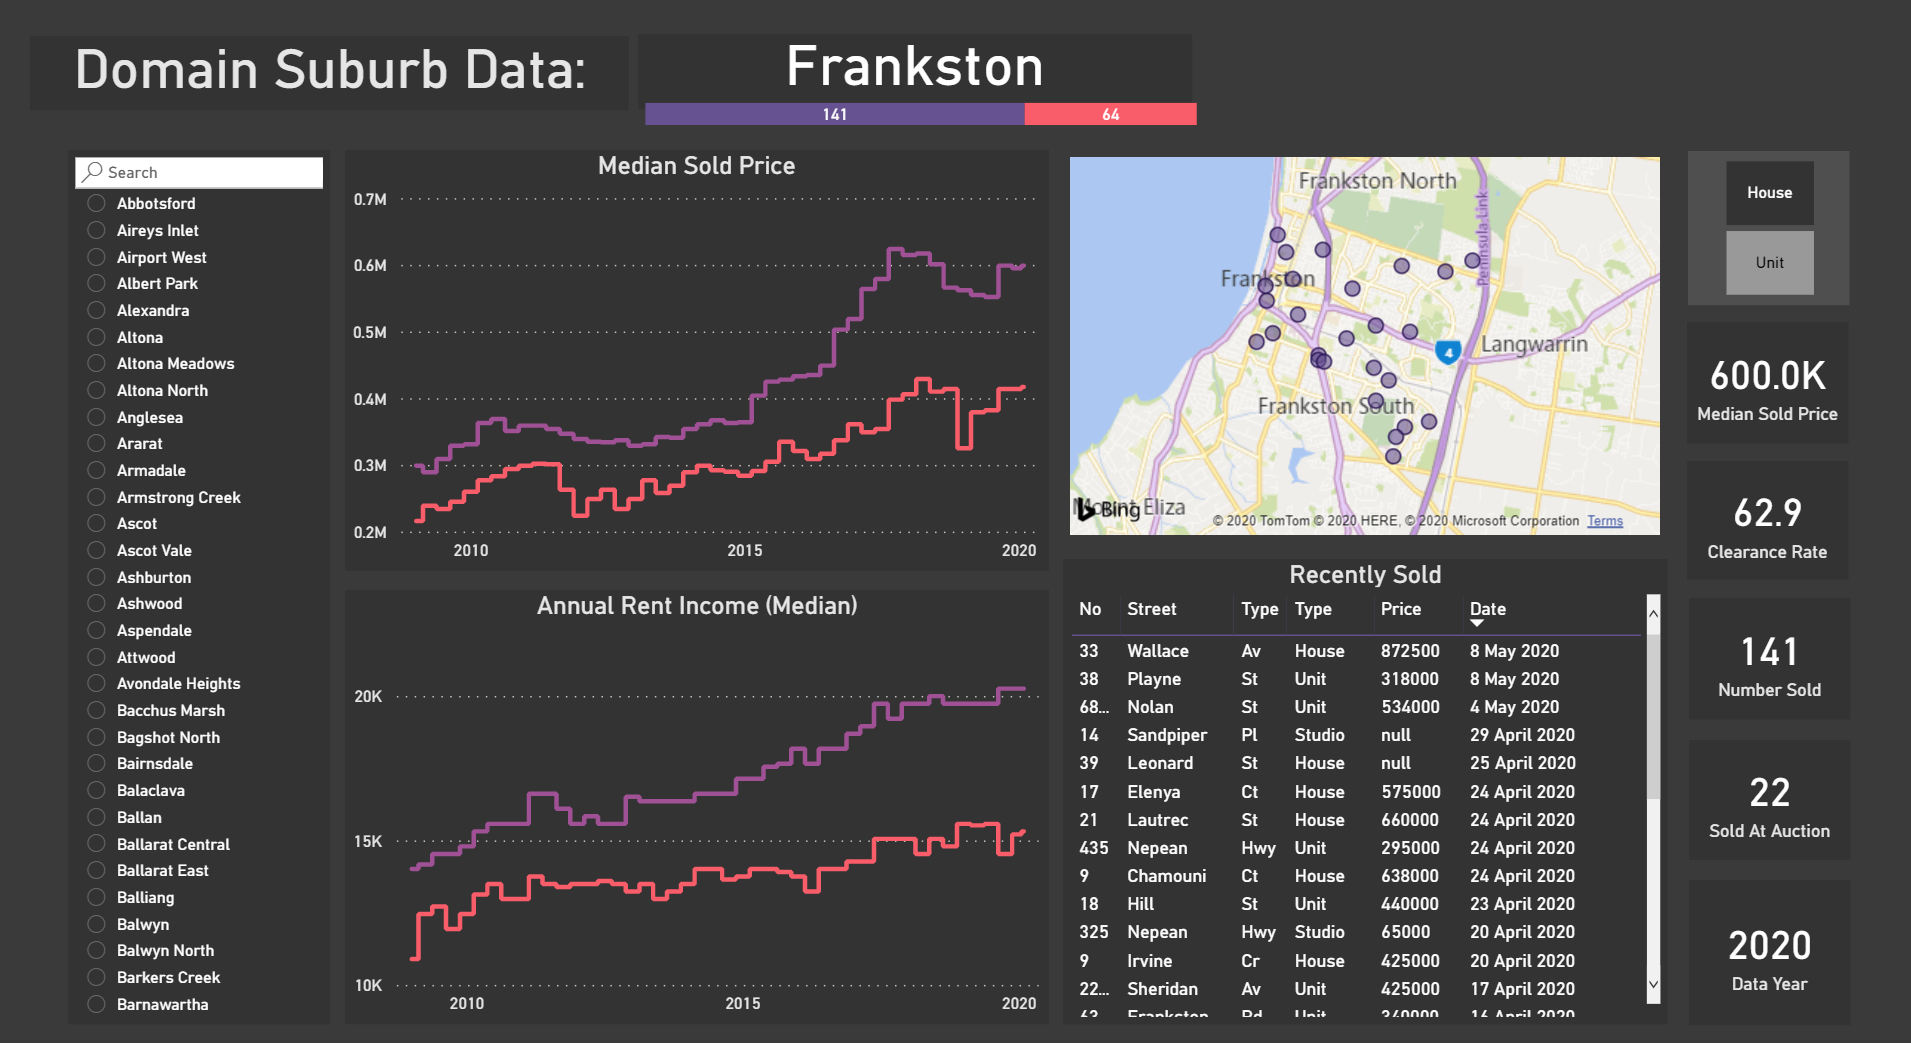
To paint a picture, imagine walking through a neighborhood and noticing a property for sale. Maybe you’re looking at getting into the market? The agent’s valuation looks competitive and the house suits your criteria, wonder what it might go for? With this project I can open Power BI on my phone, select the suburb and see how the much the property around the corner sold for at auction two weeks ago.
One would argue that using the Domain app is just as easy, and in some ways it is. The phone app in particular is great for seeing active listings, with its drop pin / map view. On the desktop site you can manually scroll back through auction results as well as explore some demographic data from the 2016 Census. The caveat to this is that it is paginated, and time quickly adds up clicking through each page (you could theoretically click your way back to the first property sold in a suburb through Domain). The power in creating your own database comes from the ability to filter data in more advanced methods. I can see auction results for any given period, median sale price at a particular year, number of properties sold in 2013 and so on.
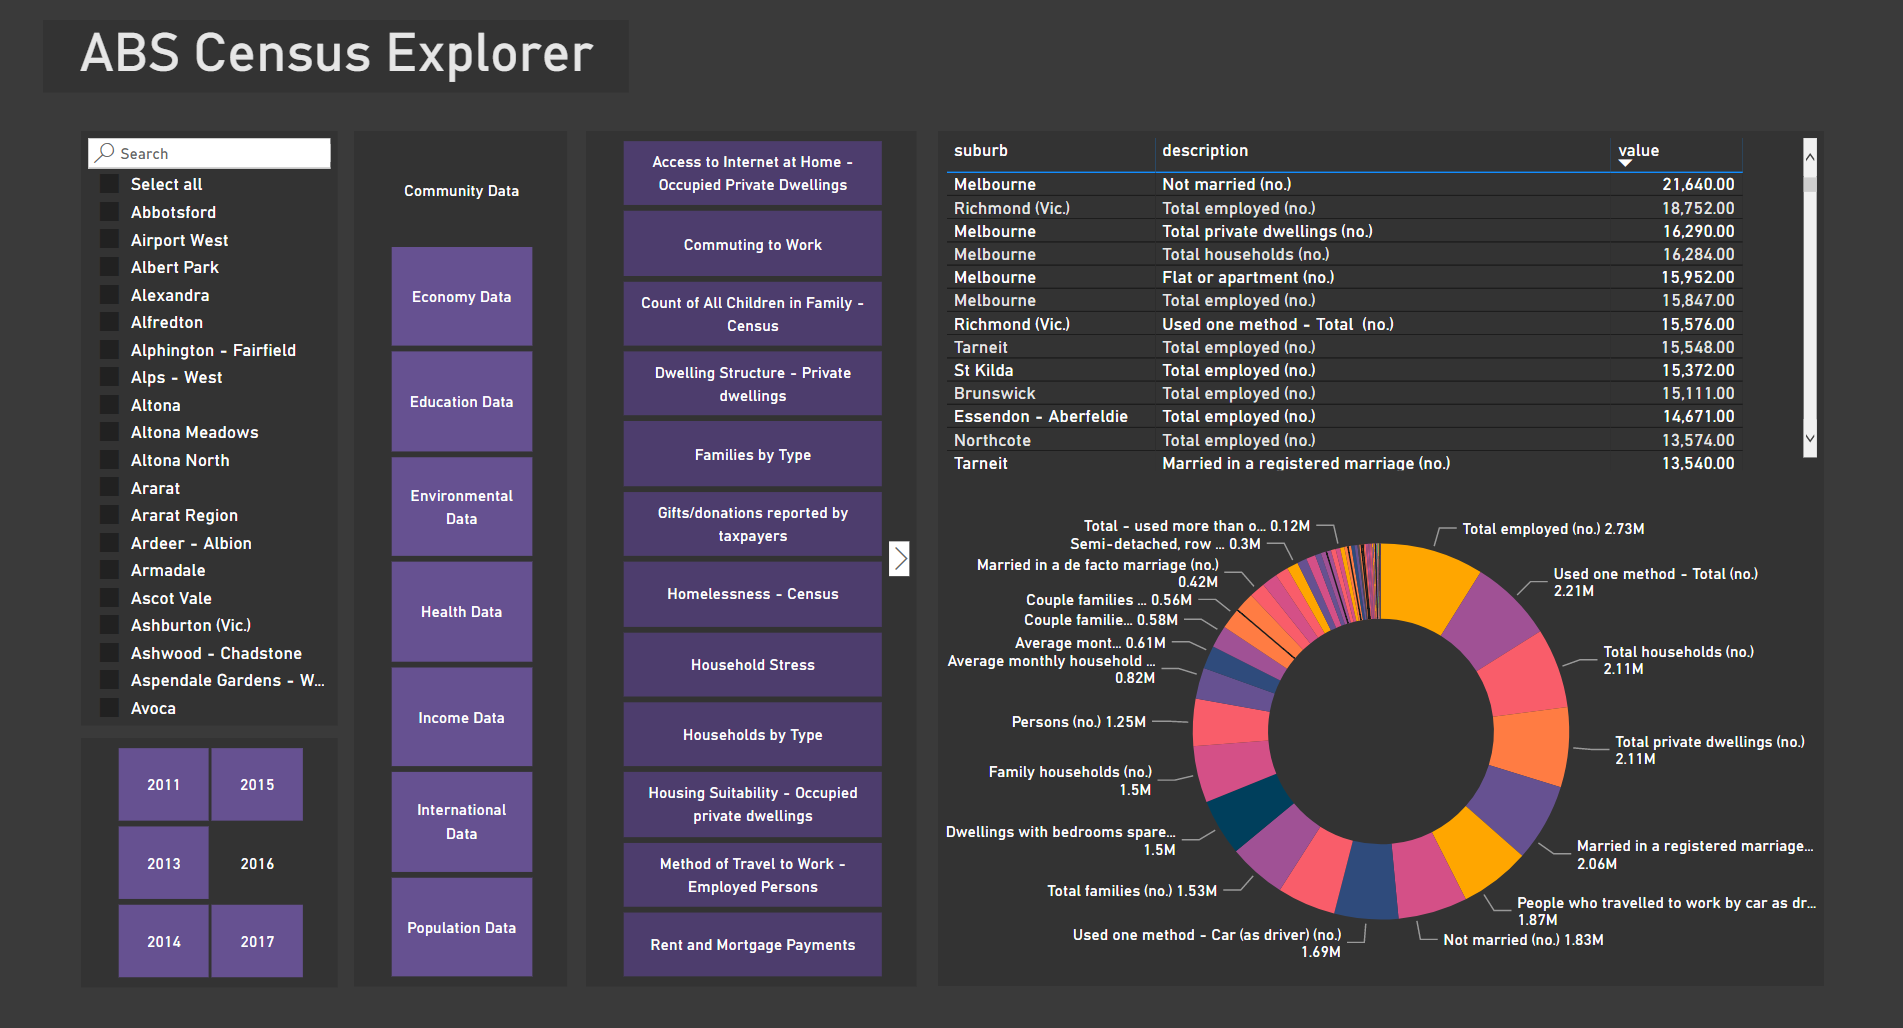
To pull the data, I had different approaches for each dataset. Since the ABS Census information is static and only released each year, it was simple enough to download the excel files, python script them into an attribute table for filtering purposes and then throw it all into a MySQL database. The Domain data on the other hand is a more complicated beast as it’s constantly updated. Domain have APIs that allow you to access their database without having to navigate the front-end service, meaning raw data can pulled down and filtered. For this, I have a set of scripts that run weekly/fortnightly/quarterly as the data is released. Using Task Scheduler, it’s possible to cue them so they run automatically without much upkeep too!
MySQL feeds directly into Power BI, and with some playing around I’ve managed to get some dashboards together featuring important information that I am interested in. Disclaimer: If it’s not already obvious it will be after reading this post, please do your own research and decide for yourself as to what information or data is useful to your circumstances when choosing a new property.
Suburbs

As for the line graphs, median sold price and annual rent income are two of about twenty available categories (25th percentile, 75th percentile, clearance rate, number of sales, etc.). Capital gain is arguably the most important factor in an investment property, and rental income is an indicator of annual return. These can be flicked to other values rather easily, however, to prevent clutter I have left them out. If I choose to dig deeper into a suburb, I might pull them out and have a look.
The auction results API is neat in that it spits out a longitude and latitude of each property, so it's easily displayed through a map plugin. Overall, this is the page I spend most of my time on.
Demographics


aUCTIONS

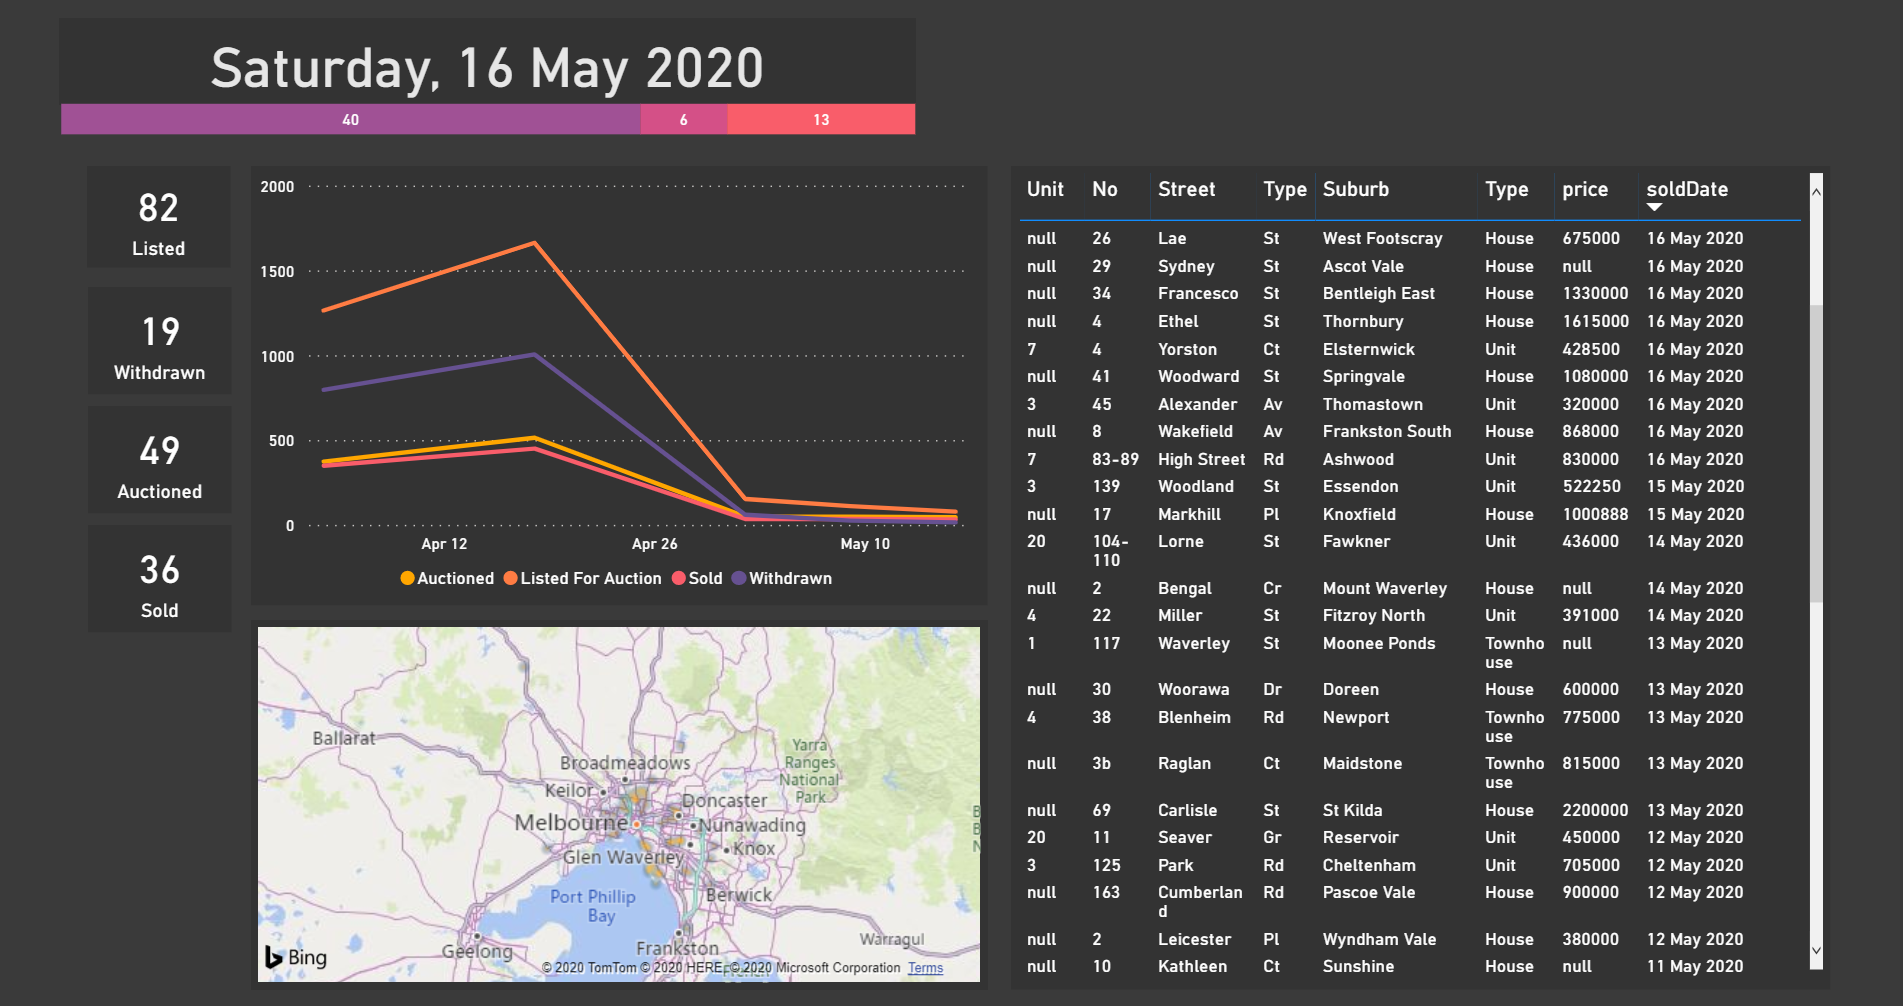
As always, there is more data then what you see in the front end. The auction results have more information, including number bedrooms, carparks, bathrooms, even which agent sold the property. You will also notice that some results have a null price, this is most likely because they were a private sale, and that information isn’t public (outside of an agency anyway).
Chlorpleth

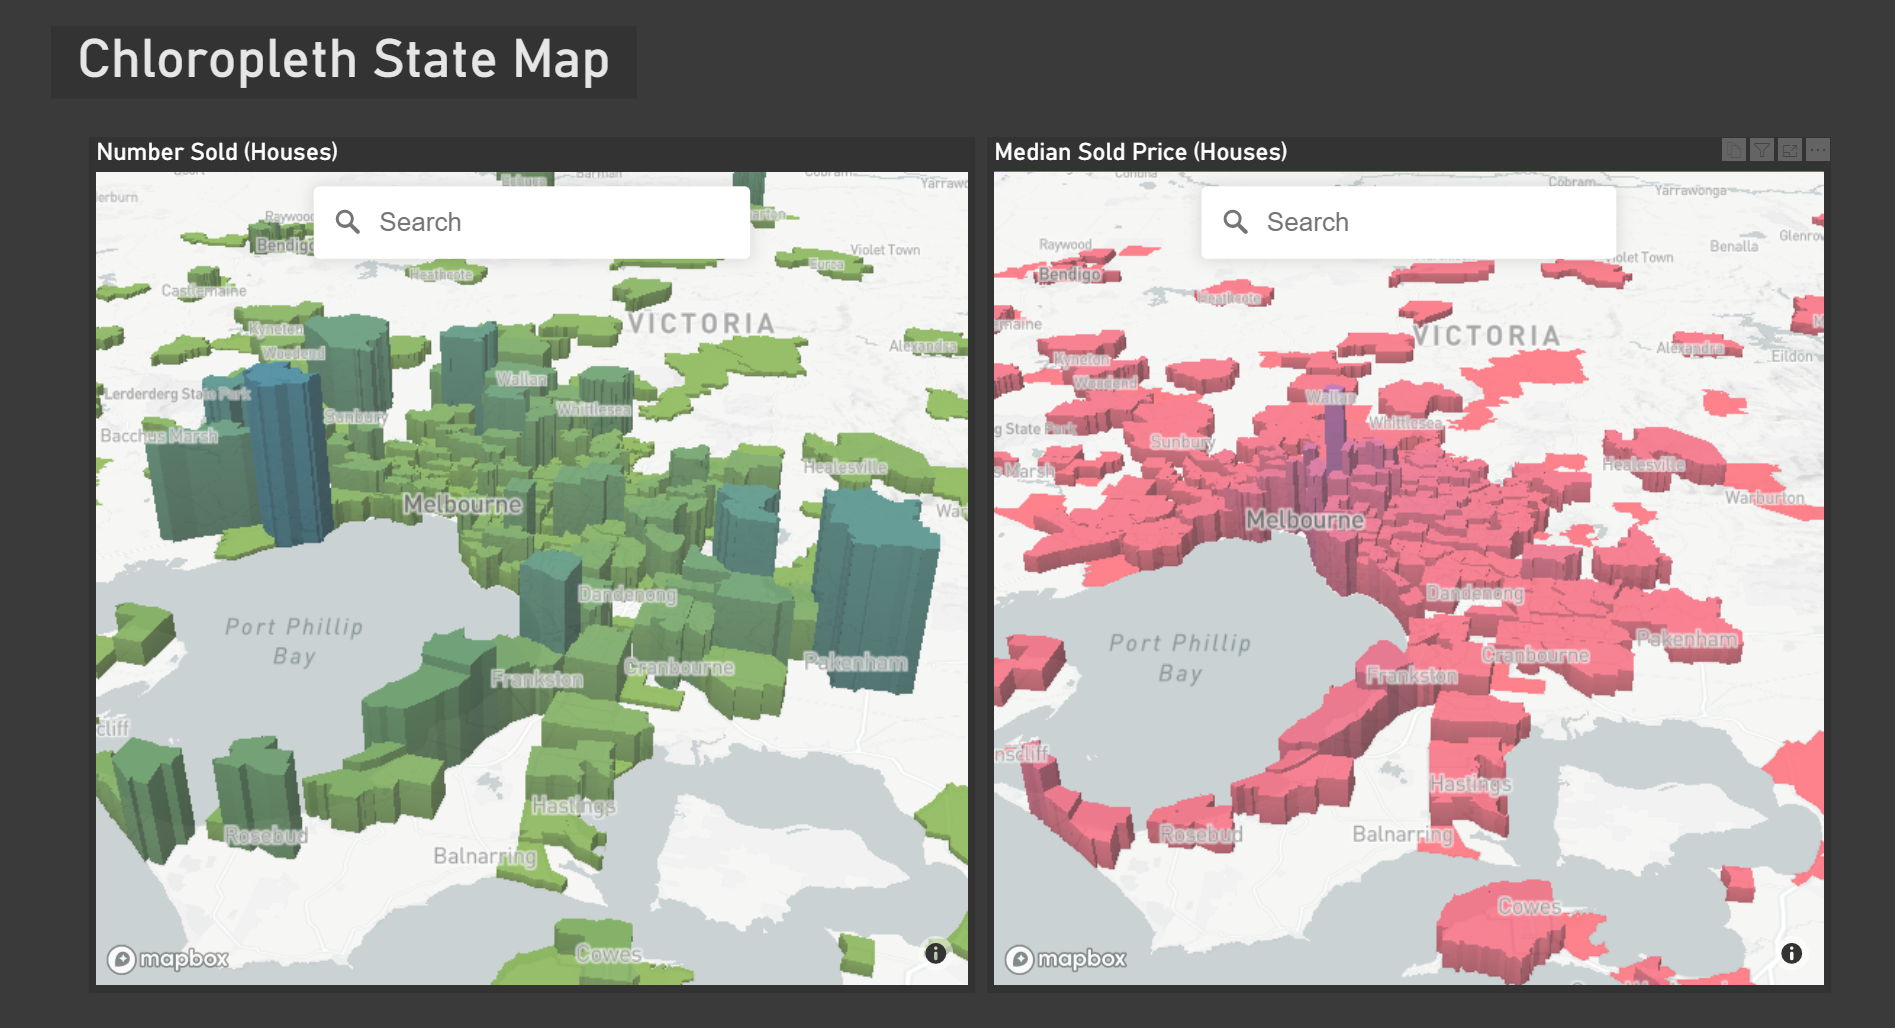
You’ll also notice that there is a scattering of suburbs outside the metropolitan area. I wanted 500 suburbs, and I wasn’t very specific in how I chose them. As a result, there are a lot of towns with little or no real estate activity. It’s good for a ‘pulse check’ in those areas to see if there are any gems, but in reality, I will most likely remove them and add suburbs in closer areas such as the Mornington Peninsula. I am after all tailoring this for my interests!
In summary
Choosing the right property is complex, and there are many factors that aren’t wholly represented in the above. Consider external factors such as economic environment, who would have guessed COVID-19 was coming two years back? Another massive hurdle is actually going out and acquiring the property itself. Organizing finances, building inspections, insurance, there’s a lot going on. Do your own research and decide for yourself which information is important in helping you make the best decision. If you’re into books, Wakelin property advisors have a great read that covers the basics.
As for playing with the data, information can be found here for Domain, and here for Real Estate. There is mountains of content available for Python, one resource I use is w3schools. Also, this project could be achieved in excel, albeit with a bit of VBA. If that’s a more familiar environment it will give you similar success. Happy coding!